CONTENTS
- DESCRIPTION
- SYNOPSIS
- EXAMPLES
- WORKBOOK METHOD
- WORKSHEET METHOD
- PAGE SET-UP METHOD
- CELL FORMATTING
- FORMAT METHODS
- COLORS IN EXCEL
- DATES AND TIME IN EXCEL
- OUTLINES AND GROUPING IN EXCEL
- DATA VALIDATION IN EXCEL
- CONDITIONAL FORMATTING IN EXCEL
- SPARKLINES IN EXCEL
- TABLES IN EXCEL
- FORMURAS AND FUNCTIONS IN EXCEL
- CHART METHODS
- CHART FONTS
- CHART LAYOUT
- SHAPE
- COMPATIBILITY WITH WRITEEXCEL
CHART LAYOUT
The position of the chart in the worksheet is controlled by the set_size method shown above.
It is also possible to change the layout of the following chart sub-objects:
:plotarea
:legend
:title
:x_axis caption
:y_axis caption
Here are some examples:
chart.set_plotarea(
  layout: {
    x:      0.35,
    y:      0.26,
    width:  0.62,
    height: 0.50
  }
)

chart.set_legend(
  layout: {
    x:      0.80,
    y:      0.37,
    width:  0.12,
    height: 0.25
  }
)

chart.set_title(
  name:   'Title',
  layout: {
    x:      0.42,
    y:      0.14
  }
)

chart.set_x_axis(
  name:        'X axis,
  name_layout: {
    x: 0.34,
    y: 0.85
  }
)
Note that it is only possible to change the width and height for the plotarea and legend objects.
For the other text based objects the width and height are
chaged by the font dimensions.
The layout units must be a float in the range 0 < x <= 1 and are expressed
as a percentage of the chart dimensions as shown below:
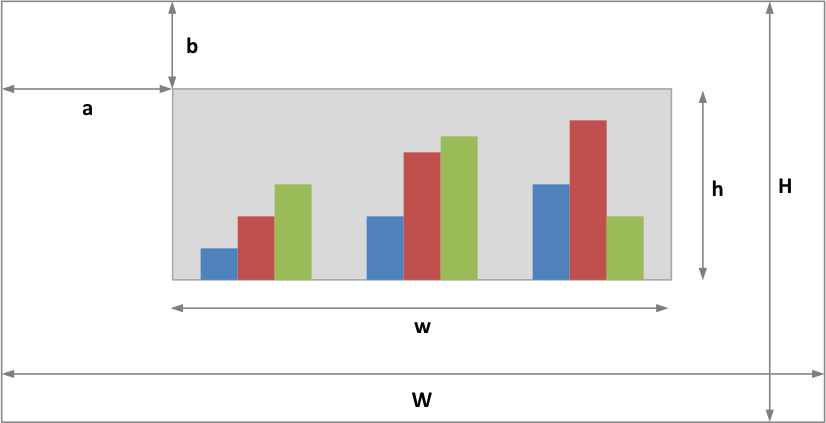
From this the layout units are calculated as follows:
layout:
  width  = w / W
  height = h / H
  x      = a / W
  y      = b / H
These units area slightly cumbersome but are required by Excel so that the chart object positions remain relative to each other if the cahrt is resized by the user.
Note that for plotarea the origin is the top left corner in the plotarea itself and does not take into account the axes.