CONTENTS
- DESCRIPTION
- SYNOPSIS
- EXAMPLES
- WORKBOOK METHOD
- WORKSHEET METHOD
- PAGE SET-UP METHOD
- CELL FORMATTING
- FORMAT METHODS
- COLORS IN EXCEL
- DATES AND TIME IN EXCEL
- OUTLINES AND GROUPING IN EXCEL
- DATA VALIDATION IN EXCEL
- CONDITIONAL FORMATTING IN EXCEL
- SPARKLINES IN EXCEL
- TABLES IN EXCEL
- FORMURAS AND FUNCTIONS IN EXCEL
- CHART METHODS
- CHART FONTS
- CHART LAYOUT
- SHAPE
- COMPATIBILITY WITH WRITEEXCEL
TABLES IN EXCEL
Tables in Excel are a way of grouping a range of cells into a single entity that has common formatting or that can be referenced from formulas. Tables can have column headers, autofilters, total rows, column formulas and default formatting.
For more information see “An Overview of Excel Tables” http://office.microsoft.com/en-us/excel-help/overview-of-excel-tables-HA010048546.aspx.
add_table(row1, col1, row2, col2, { parameter: ‘value’, … })
Tables are added to a worksheet using the add_table() method:
worksheet.add_table('B3:F7', { parameters })
The data range can be specified in ‘A1’ or ‘row/col’ notation (see also the note about CELL NOTATION for more information):
worksheet.add_table('B3:F7')
# Same as:
worksheet.add_table( 2, 1, 6, 5)
The last parameter in add_table() should be a hash containing the
parameters that describe the table options and data.
The available parameters are:
    :data
    :autofilter
    :header_row
    :banded_columns
    :banded_rows
    :first_column
    :last_column
    :style
    :total_row
    :columns
    :name
The table parameters are detailed below. There are no required parameters and the hash isn’t required if no options are specified.
:data
The :data parameter can be used to specify the data in the cells of the table.
data = [
    [ 'Apples',  10000, 5000, 8000, 6000 ],
    [ 'Pears',   2000,  3000, 4000, 5000 ],
    [ 'Bananas', 6000,  6000, 6500, 6000 ],
    [ 'Oranges', 500,   300,  200,  700 ]
]

worksheet.add_table('B3:F7', { data: data } )
Table data can also be written separately, as an array or individual cells.
# These two statements are the same as the single statement above.
worksheet.add_table('B3:F7')
worksheet.write_col('B4', data)
Writing the cell data separately is occasionally required when you need
to control the write_\*() method used to populate the cells or if you wish
to tweak the cell formatting.
The :data structure should be an array of array holding row data
as shown above.
:header_row
The :header_row parameter can be used to turn on or off the header row
in the table. It is on by default.
worksheet.add_table('B4:F7', { header_row: 0 } ) # Turn header off.
The header row will contain default captions such as Column 1, Column 2, etc. These captions can be overridden using the columns parameter below.
:autofilter
The :autofilter parameter can be used to turn on or off the autofilter
in the header row. It is on by default.
worksheet.add_table('B3:F7', { autofilter: 0 } ) # Turn autofilter off.
The :autofilter is only shown if the header_row is on.
Filters within the table are not supported.
:banded_rows
The :banded_rows parameter can be used to used to create rows of alternating
colour in the table. It is on by default.
worksheet.add_table('B3:F7', { banded_rows: 0 } )
:banded_columns
The :banded_columns parameter can be used to used to create columns of
alternating colour in the table. It is off by default.
worksheet.add_table('B3:F7', { banded_columns: 1 } )
:first_column
The :first_column parameter can be used to highlight the first column of the table.
The type of highlighting will depend on the style of the table.
It may be bold text or a different colour. It is off by default.
worksheet.add_table('B3:F7', { first_column: 1 } )
:last_column
The :last_column parameter can be used to highlight the last column of the table.
The type of highlighting will depend on the style of the table.
It may be bold text or a different colour. It is off by default.
worksheet.add_table('B3:F7', { last_column: 1 } )
:style
The :style parameter can be used to set the style of the table.
Standard Excel table format names should be used
(with matching capitalisation):
worksheet11.add_table(
    'B3:F7',
    {
        data:  data,
        style: 'Table Style Light 11',
    }
)
The default table style is ‘Table Style Medium 9’.
You can also turn the table style off by setting it to ‘None’:
worksheet11.add_table('B3:F7', style: 'None')
:name
The :name parameter can be used to set the name of the table.
By default tables are named Table1, Table2, etc.
If you override the table name you must ensure that it doesn’t clash with an
existing table name and that it follows Excel’s requirements for table names (for example that it doesn’t contain spaces).
worksheet.add_table('B3:F7', { name: 'SalesData' } )
If you need to know the name of the table, for example to use it in a formula, you can get it as follows:
table      = worksheet2.add_table('B3:F7')
table_name = table.name
:total_row
The :total_row parameter can be used to turn on the total row in the last row
of a table. It is distinguished from the other rows by a different formatting
and also with dropdown SUBTOTAL functions.
worksheet.add_table('B3:F7', { total_row: 1 } )
The default total row doesn’t have any captions or functions. These must by specified via the columns parameter below.
:columns
The :columns parameter can be used to set properties for columns within the table.
The sub-properties that can be set are:
:header
:formula
:total_string
:total_function
:total_value
:format
:header_format
The column data must be specified as an array of hash. For example to override the default ‘Column n’ style table headers:
worksheet.add_table(
    'B3:F7',
    {
        data:    data,
        columns: [
            { header: 'Product' },
            { header: 'Quarter 1' },
            { header: 'Quarter 2' },
            { header: 'Quarter 3' },
            { header: 'Quarter 4' }
        ]
    }
)
If you don’t wish to specify properties for a specific column you pass an empty hash and the defaults will be applied:
        ...
        columns: [
            { header: 'Product' },
            { header: 'Quarter 1' },
            { },                        # Defaults to 'Column 3'.
            { header: 'Quarter 3' },
            { header: 'Quarter 4' }
        ]
        ...
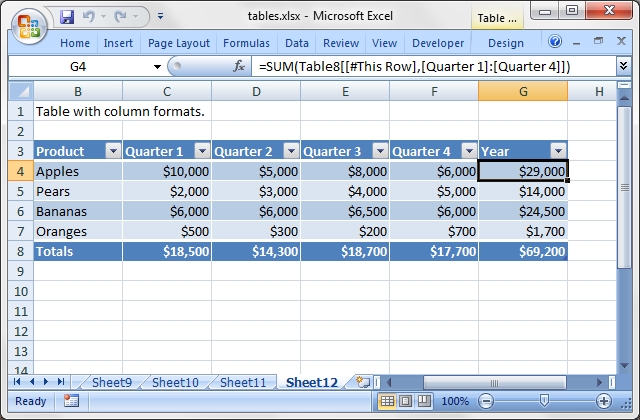
Column formulas can by applied using the formula column property:
worksheet8.add_table(
    'B3:G7',
    {
        data:    data,
        columns: [
            { header: 'Product' },
            { header: 'Quarter 1' },
            { header: 'Quarter 2' },
            { header: 'Quarter 3' },
            { header: 'Quarter 4' },
            {
                header:  'Year',
                formula: '=SUM(Table8[@[Quarter 1]:[Quarter 4]])'
            }
        ]
    }
)
The Excel 2007 [#This Row] and Excel 2010 @ structural references are supported within the formula.
As stated above the :total_row table parameter turns on the “Total” row
in the table but it doesn’t populate it with any defaults.
Total captions and functions must be specified via the :columns property
and the :total_string, :total_function and :total_value sub properties:
worksheet10.add_table(
    'B3:F8',
    {
        data:      data,
        total_row: 1,
        columns:   [
            { header: 'Product',   total_string:   'Totals' },
            { header: 'Quarter 1', total_function: 'sum' },
            { header: 'Quarter 2', total_function: 'sum' },
            { header: 'Quarter 3', total_function: 'sum' },
            { header: 'Quarter 4', total_function: 'sum' }
        ]
    }
)
The supported totals row SUBTOTAL functions are:
    average
    count_nums
    count
    max
    min
    std_dev
    sum
    var
User defined functions or formulas aren’t supported.
+It is also possible to set a calculated value for the
total_function using the total_value sub property. This is only
necessary when creating workbooks for applications that cannot
calculate the value of formulas automatically. This is similar to
setting the value optional property in write_formula:
worksheet10.add_table(
    'B3:F8',
    {
        data:      data,
        total_row: 1,
        columns:   [
            { total_string:   'Totals' },
            { total_function: 'sum', total_value: 100 },
            { total_function: 'sum', total_value: 200 },
            { total_function: 'sum', total_value: 100 },
            { total_function: 'sum', total_value: 400 }
        ]
    }
)
Formatting can also be applied to columns, to the column data using format and to the header using header_format:
currency_format = workbook.add_format(num_format: '$#,##0')
bold            = workbook.add_format(bold: true)

worksheet.add_table(
    'B3:D8',
    {
        data:      data,
        total_row: 1,
        columns:   [
            { header: 'Product', total_string: 'Totals' },
            {
                header:         'Quarter 1',
                total_function: 'sum',
                format:         currency_format,
            },
            {
                header:         'Quarter 2',
                header_format:  bold,
                total_function: 'sum',
                format:         currency_format,
            }
        ]
    }
)
Standard WriteXLSX format objects can be used. However, they should be limited to numerical formats for the columns and simple formatting like text wrap for the headers. Overriding other table formatting may produce inconsistent results.